This is an old revision of the document!
Table of Contents
HPC Cluster Monitoring
Ganglia
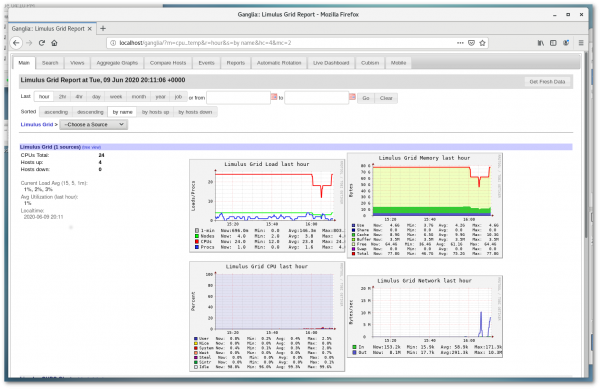
On HPC systems the popular Ganglia monitoring tool is available. To bring up the Ganglia interface simple enter:
http://localhost/ganglia/
In Firefox (or any other browser that is installed on the system) the default screen is shown below.
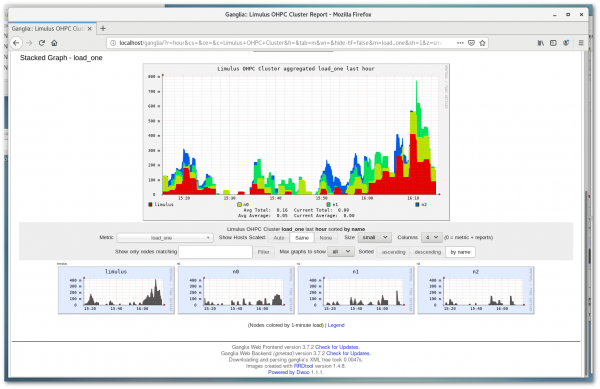
Clicking on the Limulus OHPC Cluster in the Choose a Source drop-down menu will show the individual nodes in the cluster. The load_one (one minute load) is displayed in total and for the individual nodes (shown below).
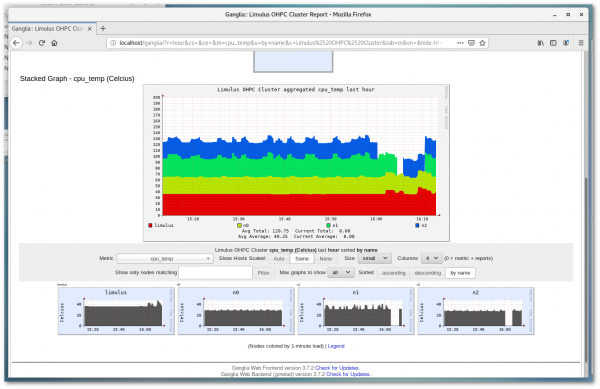
Note that in addition to a myriad of other metrics it is possible to observe the CPU temperatures by selecting cpu_temp (as shown below)
More information on using and configuration can be found at the Ganglia web site
Warewulf Top (wwtop)
Warewulf Top is a command line tool for monitoring the state of the cluster. Similar to the top command wwtop is part of the Warewulf cluster provisioning and management system used on Limulus HPC systems. To run Warewulf Top enter:
wwtop
The following screen will update in real time.
Operation of the wwtop interface is described by the command help option shown below.
USAGE: /usr/bin/wwtop [options]
  About:
    wwtop is the Warewulf 'top' like monitor. It shows the nodes ordered by
    the highest utilization, and important statics about each node and
    general summary type data. This is an interactive curses based tool.

  Options:
   -h, --help       Show this banner

  Runtime Options:
    Filters (can also be used as command line options):
       i   Display only idle nodes
       d   Display only dead and non 'Ready' nodes
       f   Flush any current filters
    Commands:
       s   Sort by: nodename, CPU, memory, network utilization
       r   Reverse the sort order
       p   Pause the display
       q   Quit
    Views:
       You can use the page up, page down, home and end keys to scroll through
       multiple pages.

  This tool is part of the Warewulf cluster distribution
     http://warewulf.lbl.gov/


